Introduction
The unadjusted risk ratio (RR) is a statistical measure used to quantify the association between the occurrence of an event in two groups. Specifically, it compares the risk of an event in one group to the risk in another group without making adjustments for other variables.
The unadjusted risk ratio provides a simple and direct measure of the relative risk between two groups. If the risk ratio is equal to 1, it suggests that the risk of the event is the same in both groups. A risk ratio greater than 1 indicates an increased risk in Group 1 compared to Group 2, while a risk ratio less than 1 suggests a decreased risk in Group 1.
This article introduces a web-based tool designed to calculate the unadjusted risk ratio along with its confidence interval, Z-score, and p-value. The tool is valuable for researchers and analysts who need to evaluate the relative risk associated with different groups in a study.
Variables Definitions
Event 1: The number of occurrences of the event in Group 1.
Total 1: The total number of observations in Group 1.
Event 2: The number of occurrences of the event in Group 2.
Total 2: The total number of observations in Group 2.
Confidence Level: The desired confidence level for the confidence interval is expressed as a decimal (e.g., 0.95 for 95%).
Calculation Formulas
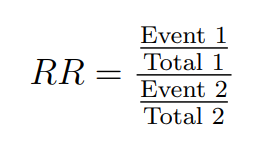
Unadjusted Risk Ratio (RR):
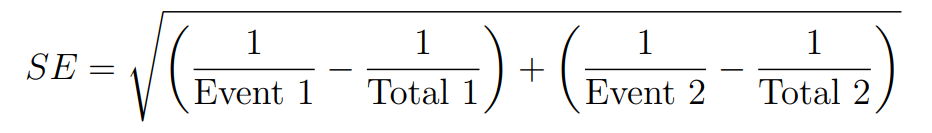
Standard Error (SE):
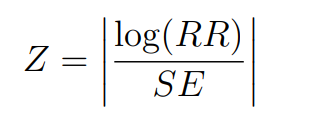
Z-score:
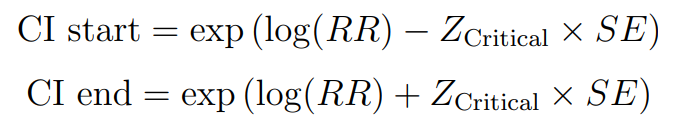
Confidence Interval (CI):
P-value:
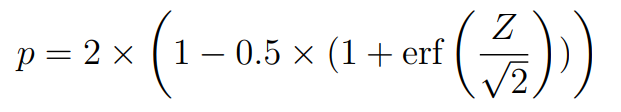
Where erf is the error of function implementation