Introduction
A confidence interval is a statistical concept that provides a range of values within which we can reasonably expect a population parameter to lie. It is often used to quantify the uncertainty or margin of error associated with a sample estimate of a population parameter. The confidence interval is expressed as a range, and it is associated with a certain level of confidence, typically denoted as a percentage. For example, a 95% confidence interval indicates that there is a 95% probability that the true parameter falls within the calculated interval.
Standard deviation is a measure of the amount of variation or dispersion in a set of values. It indicates how spread out the values in a data set are from the mean (average). A low standard deviation suggests that the data points tend to be close to the mean, while a high standard deviation indicates that the data points are spread out over a wider range.
Sometimes, researchers may need to convert the information from a confidence interval into a standard deviation. This article introduces a tool designed to calculate the standard deviation from a given confidence interval, making it easier for researchers to work with different forms of statistical data.
Variables Definitions
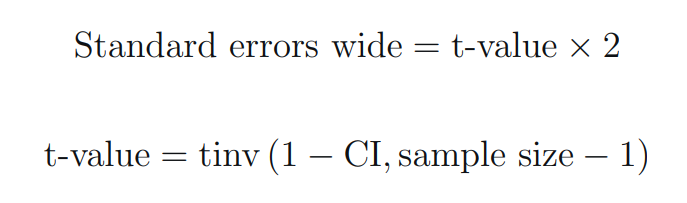
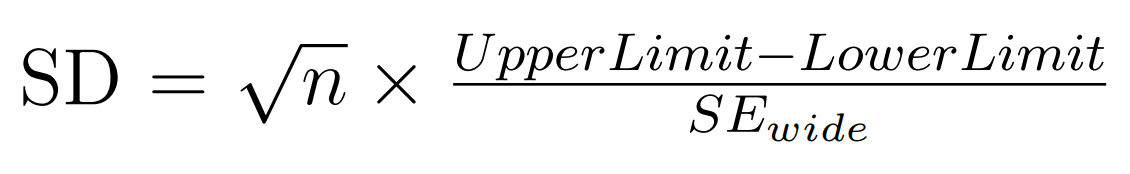
- Confidence Interval (CI): This represents the confidence level expressed as a decimal value. For example, 0.95 corresponds to a 95% confidence interval.
- Number of Participants (n): The total number of individuals or data points in the sample or study.
- Upper CI Limit: The upper limit of the confidence interval.
- Lower CI Limit: The lower limit of the confidence interval.
- Standard Deviation (SD): The calculated standard deviation based on the provided confidence interval information.