Introduction
Range:
Definition: The range is a measure of dispersion that represents the difference between the largest and smallest values in a dataset. It is the simplest measure of spread and provides a quick indication of how much the values in a dataset vary.
Interpretation:
- A larger range indicates greater variability or dispersion in the data.
- A smaller range suggests that the values in the dataset are closely packed together.
Limitations:
- The range is sensitive to outliers; extreme values can disproportionately affect the range.
- It doesn't provide information about the distribution of values within the range.
Standard Deviation (SD):
Definition: The standard deviation is a measure of the amount of variation or dispersion in a set of values. It quantifies how much individual values deviate from the mean (average) of the dataset. A low standard deviation indicates that the data points tend to be close to the mean, while a high standard deviation indicates that the data points are spread out over a larger range of values.
Interpretation:
- A small standard deviation suggests that the data points are close to the mean.
- A large standard deviation indicates that the data points are spread out over a wider range.
- The standard deviation is particularly useful when the data follows a normal distribution.
Limitations:
- Like the range, the standard deviation is sensitive to outliers.
- It may not be appropriate for highly skewed or non-normally distributed data.
The Range to Standard Deviation (SD) Calculator is a helpful tool that allows users to estimate the standard deviation of a dataset based on the given range and sample size. This conversion is particularly useful when only the range is available, and a measure of dispersion, such as the standard deviation, is required for statistical analysis. Let's explain the variables involved and the calculation process.
Variables Definitions
- Minimum: The smallest value in the dataset or sample.
- Maximum: The largest value in the dataset or sample.
- Sample Size (N): The total number of data points or observations in the sample.
- Estimated SD: The calculated standard deviation is estimated based on the provided range and sample size.
Conversion Formula
The conversion process involves several steps to estimate the standard deviation based on the given range (R) and sample size (N):
- Calculate the Range (R):
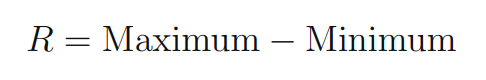
Range - Determine the Conversion Factor (f):
- The conversion factor (f) is dependent on the sample size (N).
- The tool provides a range of conversion factors for different sample sizes based on empirical values. These values were mentioned in the Walter et al. method.
- Calculate the Estimated Standard Deviation:
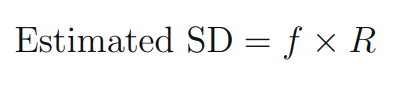
Estimated SD