Introduction
Standard deviation is a statistical measure that quantifies the amount of variation or dispersion in a set of data points. It provides a way to express how spread out the values in a data set are from the mean (average). A low standard deviation indicates that the data points tend to be close to the mean, while a high standard deviation suggests that the data points are spread out over a wider range.
The standard error is a measure of the variability of sample means and provides an estimate of how much the sample mean is likely to deviate from the true population mean. It is particularly important in inferential statistics, where we use sample data to make inferences about a population.
Interpretation:
- Standard Deviation (SD): A lower SD indicates that the data points are close to the mean, while a higher SD suggests a wider spread of data points.
- Standard Error (SE): A lower SE indicates that the sample mean is likely to be close to the population mean, while a higher SE suggests greater uncertainty in the estimate.
This article introduces a conversion tool that facilitates the calculation of the standard deviation from the standard error, providing researchers and analysts with a practical solution for their statistical needs.
Variables Definitions
- Standard Error (SE) in the Group: The standard error is a measure of the precision of the sample mean. It quantifies the variability of sample means around the true population mean.
- Sample Size of the Group: The number of observations or data points in the sample. The sample size is a critical factor in determining the precision of the sample mean.
- Standard Deviation in the Group: The calculated standard deviation is based on the provided standard error and sample size.
Conversion Formula
The conversion from standard error to standard deviation is done using the formula:
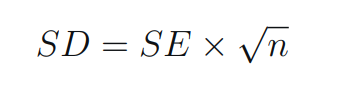
SD Standard Deviation; SE Standard Error; n Sample Size