Introduction
- Median:
- The median is the middle value of a dataset when it is ordered from least to greatest. If the dataset has an odd number of observations, the median is the middle value. If the dataset has an even number of observations, the median is the average of the two middle values.
- Unlike the mean, extreme values do not affect the median, making it a robust measure of central tendency.
- Interquartile Range (IQR):
- The interquartile range (IQR) is a measure of statistical dispersion, or in simpler terms, the spread of the middle 50% of a dataset. It is calculated as the difference between the third quartile (Q3) and the first quartile (Q1).
- Quartiles are values that divide a dataset into four equal parts. Q1 is the value below which 25% of the data falls, and Q3 is the value below which 75% of the data falls.
- Mean:
- The mean, also known as the average, is calculated by summing up all values in a dataset and dividing the sum by the number of observations. It is a measure of central tendency that represents the balance point of a distribution.
- The mean is sensitive to extreme values, making it less robust than the median in the presence of outliers.
- Standard Deviation:
- The standard deviation is a measure of the amount of variation or dispersion in a set of values. It quantifies how much individual values in a dataset differ from the mean.
- It is calculated by taking the square root of the variance, where the variance is the average of the squared differences between each value and the mean.
- A small standard deviation indicates that the values in a dataset are close to the mean, while a large standard deviation indicates greater variability.
In statistical analysis, researchers often encounter summary statistics like the median and interquartile range (IQR) that describe the central tendency and spread of a dataset. This article introduces a tool designed to calculate the mean and standard deviation from the median and IQR. Understanding the conversion between these measures allows for a more comprehensive analysis of data distributions.
Variables Definitions
- Median: The middle value of a dataset, separating the higher half from the lower half.
- Q1 (First Quartile): The value below which 25% of the data falls.
- Q3 (Third Quartile): The value below which 75% of the data falls.
- Sample Size: The number of observations in the dataset.
- Mean: The average value of the dataset.
- Standard Deviation (SD): A measure of the amount of variation or dispersion in a set of values.
Conversion Formula
The conversion process involves the following steps:
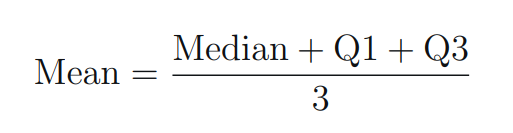
- Estimating the Mean:
Estimating Mean - The standard deviation is calculated here using the Wan et al. method:
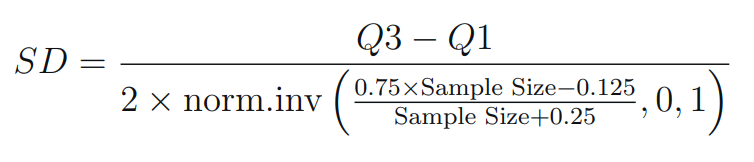
SD using Wan et al. method