Introduction
The mean, also known as the average, is a measure of central tendency that represents the sum of a set of values divided by the number of values in the set. It provides a single value that is indicative of the center of the data.
The standard deviation is a measure of the amount of variation or dispersion in a set of values. It quantifies how much individual values in a dataset deviate from the mean. A smaller standard deviation indicates that the values tend to be close to the mean, while a larger standard deviation suggests greater variability.
Mean Change: The change in mean represents the difference between the average values of a variable before and after a specific event or intervention. It is calculated by subtracting the initial mean from the final mean.
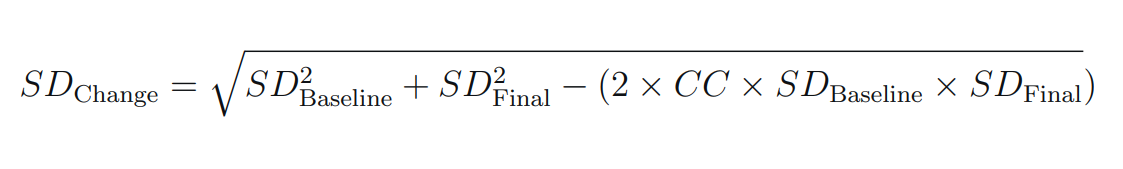
SD Change: The change in standard deviation represents alterations in the dispersion of values. It considers the standard deviations before and after an event, accounting for the correlation coefficient between the two sets of measurements (post - pre).
In statistical analysis and meta-analysis, understanding the change in mean and standard deviation (SD) between two time points is crucial for assessing the impact of interventions or treatments. This article introduces a tool designed to calculate the change in mean and SD from baseline, considering the correlation coefficient between the two sets of measurements.
Variables Definitions
- Mean (pre) and SD (pre):
- Mean (pre): The average value of the data before an intervention or treatment.
- SD (pre): The standard deviation representing the dispersion of values before the intervention.
- Mean (post) and SD (post):
- Mean (post): The average value of the data after an intervention or treatment.
- SD (post): The standard deviation representing the dispersion of values after the intervention.
- Correlation Coefficient (CC):
- Correlation Coefficient (CC): A measure of the strength and direction of the linear relationship between the pre- and post-measurements.
Conversion Formula
- Calculating the Correlation Coefficient (CC) if not provided.
- Find a study that reported the pre-, post-, and change in SD in the experimental group to calculate the CC in this group. And the pre-, post-, and change in SD in the control group to calculate the CC in this group.
- Calculate the CC in the experimental group (E). Click here to calculate the CC
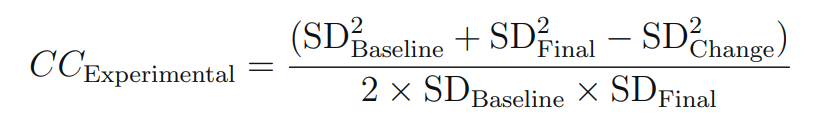
CC in the Experimental group
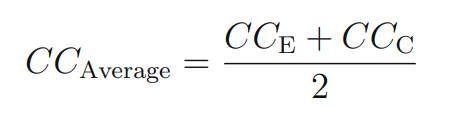
- Calculate the CC in the control group (C) in the same way.
3. You now have two values, CC (E) and CC (C). You can now find the average using this equation:
Correlation coefficients lie between –1 and 1. If a value less than 0.5 is obtained, then there is no value in using change from baseline, and an analysis of final values will be more precise.
- What if a study does not report the pre- and post-mean, SD, and change from baseline? In such cases, you can use a CC of 0.5 as a rule of thumb. According to Cochrane recommendations, using a CC lower than 0.5 is generally meaningless. A common mistake is to use a CC of 0 simply because the CC ranges from -1 to +1. This is not so accurate, as it assumes no correlation between the pre- and post-data, even though they come from the same patients.
4. SD change calculation: