Introduction
Cohen's d and effect size correlation (r) are two commonly used measures in statistics to quantify the size of the difference or relationship between groups or variables. Both metrics are used to express effect size.
Cohen's d is commonly used in the context of comparing the means of two groups to determine the practical significance of the difference. Effect size correlation (r) is a measure used to express the strength and direction of the relationship between two variables.
This article introduces a tool that facilitates the calculation of Cohen's d and effect size correlation (r) using means and standard deviations (SDs).
Variables Definitions
- Mean Group 1: The average value of the variable being measured in Group 1.
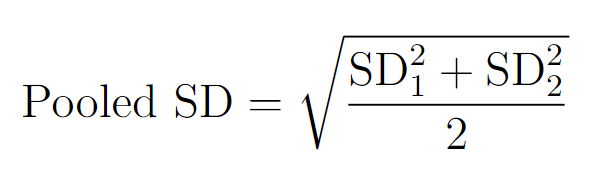
- SD Group 1: The standard deviation, a measure of the variability, in Group 1.
- Mean Group 2: The average value of the variable being measured in Group 2.
- SD Group 2: The standard deviation in Group 2.
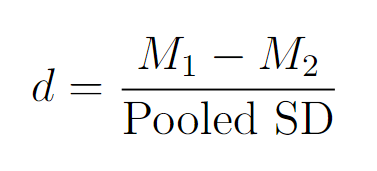
- Cohen's d: The calculated effect size that represents the standardized mean difference between Group 1 and Group 2.
- Effect Size (r): The calculated effect size correlation represents the strength and direction of the relationship between Group 1 and Group 2.
Conversion Formulas
- Calculation of Cohen's (d):
- Calculation of Effect Size (r):
- Effect size correlation (r) is calculated using the formula:
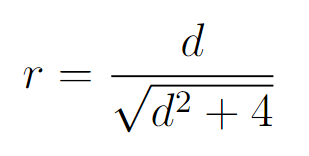
Effect size correlation (r) - Note: (d) and (r) are positive if the mean difference is in the predicted direction.
- Effect size correlation (r) is calculated using the formula:
- Cohen's d: A larger d value indicates a larger effect size. A common rule of thumb for interpreting Cohen's d is:
- Small effect: d ≈ 0.2
- Medium effect: d ≈ 0.5
- Large effect: d ≈ 0.8
- Effect Size Correlation r: The magnitude of (r) indicates the strength of the relationship:
- Small effect: ∣r∣ ≈ 0.1
- Medium effect: ∣r∣ ≈ 0.3
- Large effect: ∣r∣ ≈ 0.5